A Brehnor Communications product
Performance reporting built for financial advisory firms
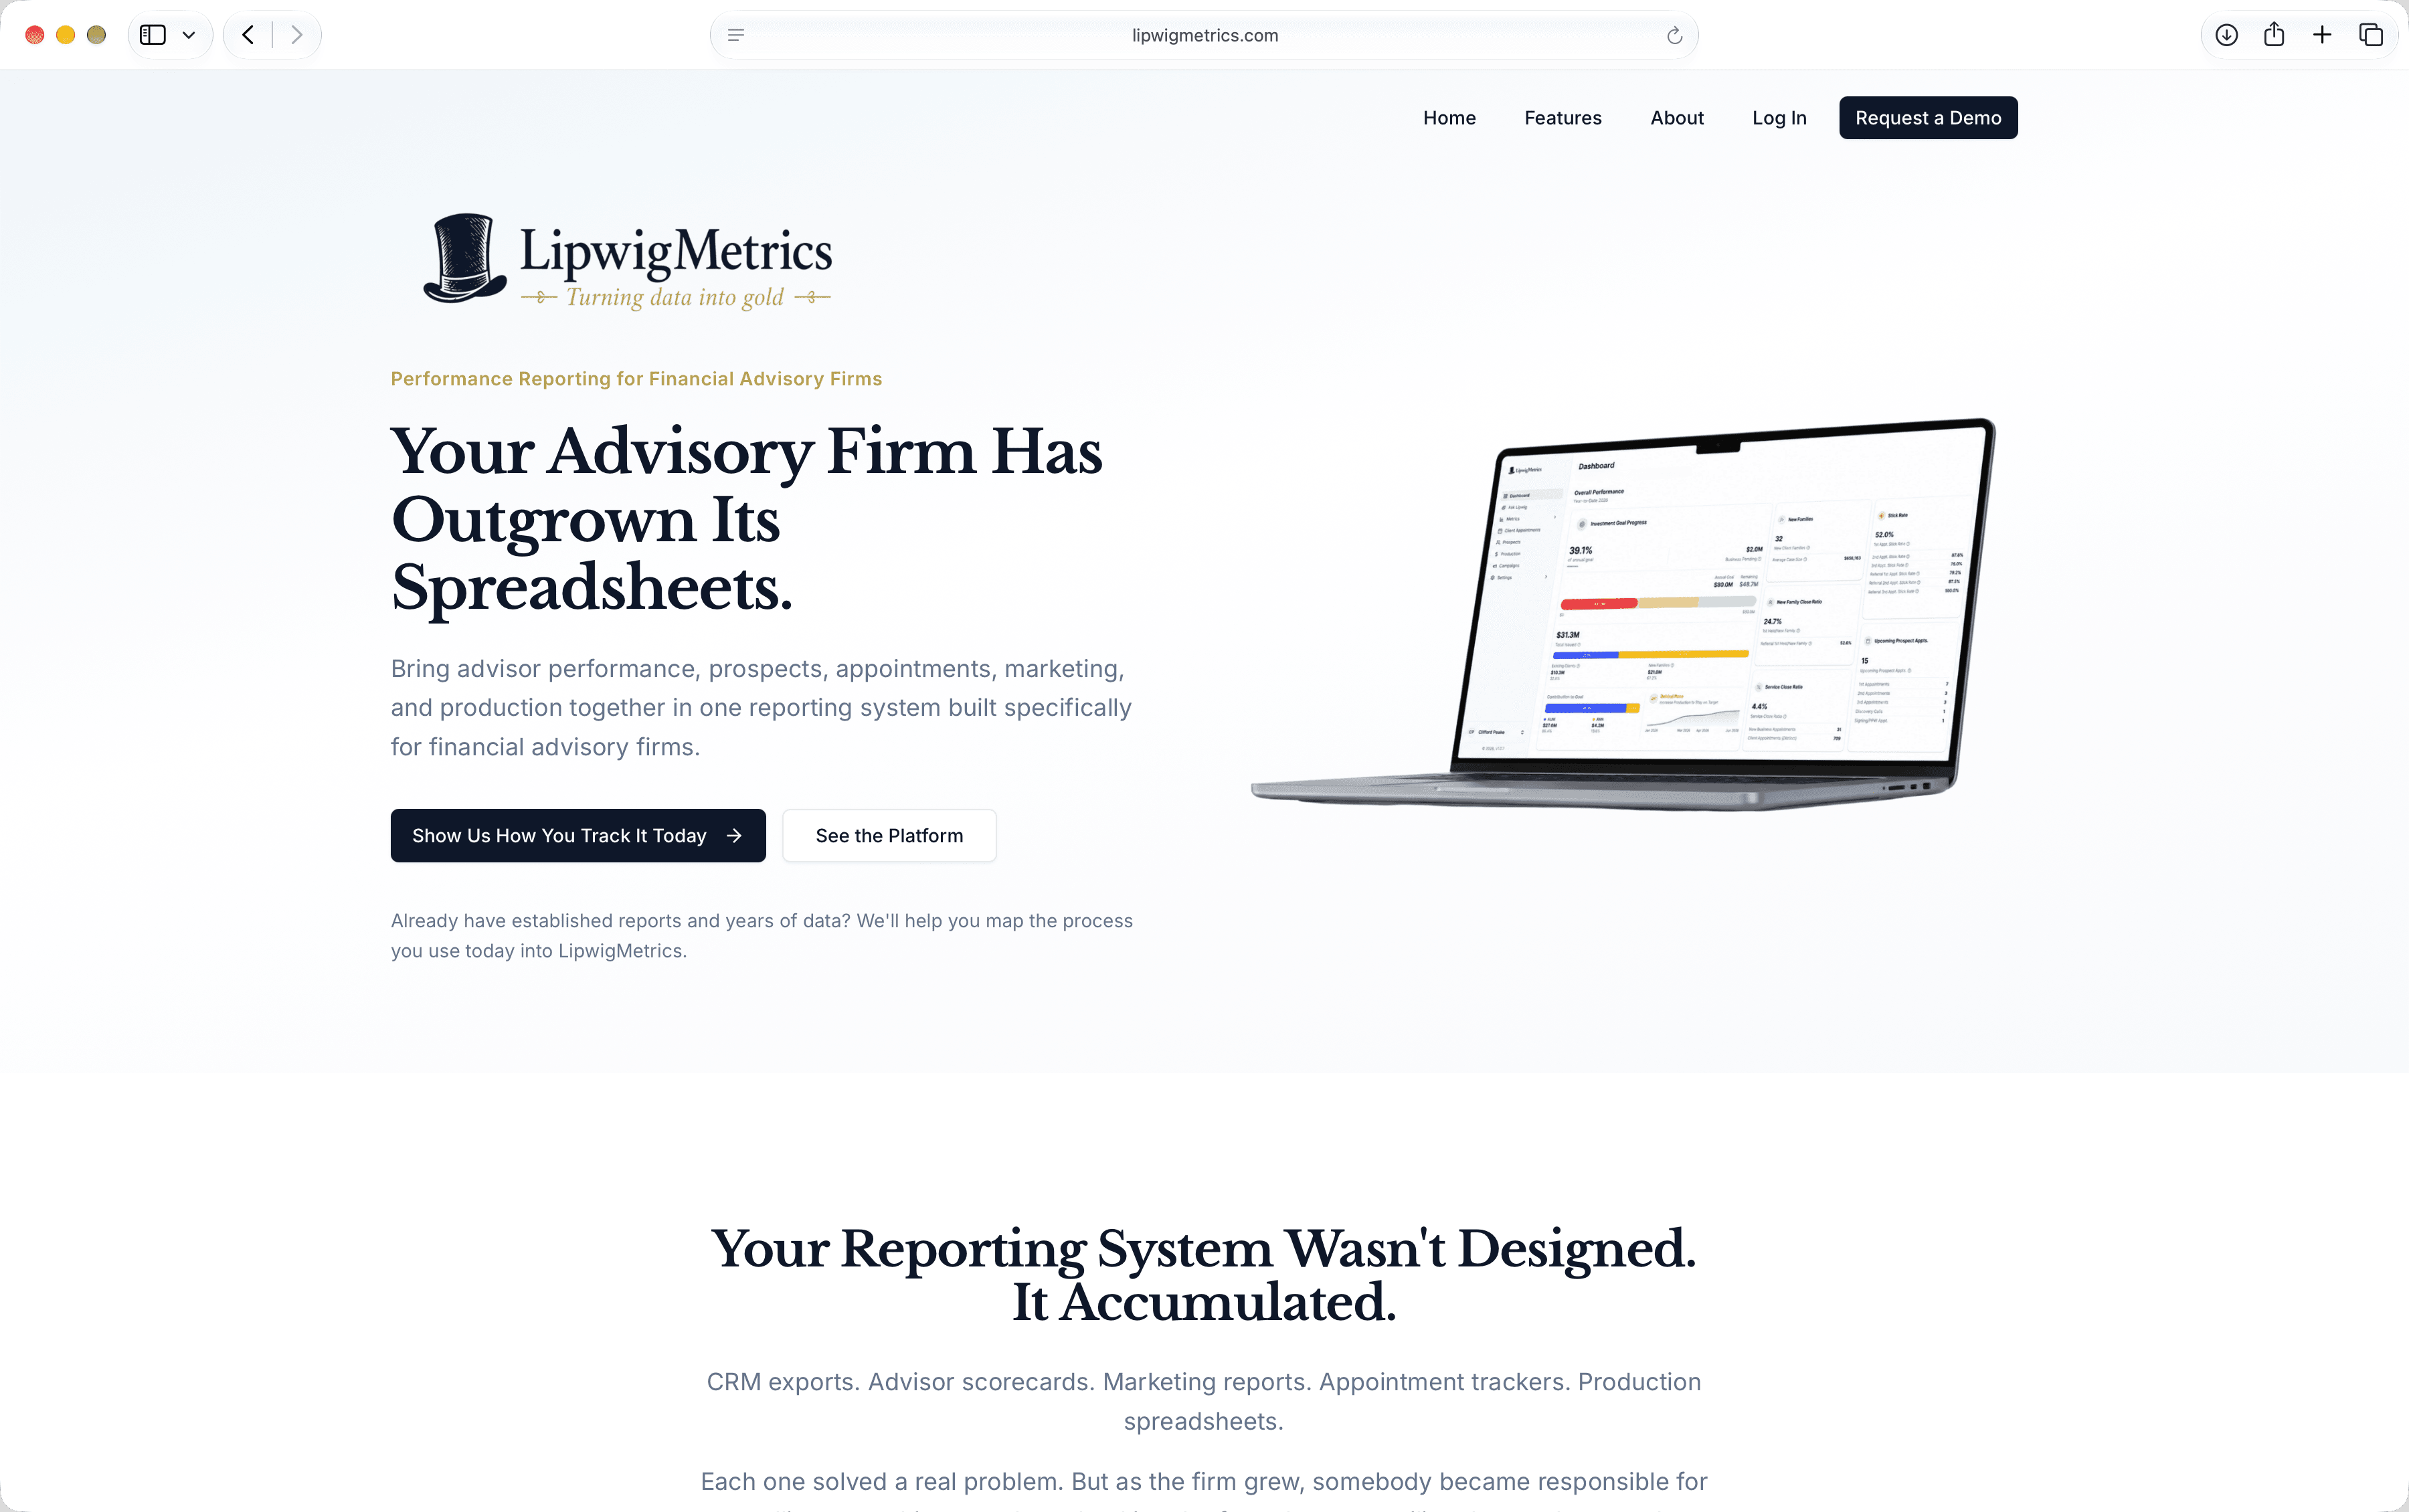
LipwigMetrics brings advisor performance, prospects, appointments, marketing, production, and leadership reporting into one system. Firm leaders get a consistent view of performance without rebuilding reports from disconnected spreadsheets every month.
Already have established reports and years of data? LipwigMetrics starts with the reporting process your firm uses today.
The reporting problem
Your reporting system grew one spreadsheet at a time
A prospect tracker solved one problem. Advisor scorecards solved another. Marketing reports, appointment logs, production spreadsheets, and monthly management packs followed.
Each report had a purpose, but somebody still had to bring the numbers together. That meant exporting data, checking formulas, resolving inconsistencies, and rebuilding the same management report for every review.
As the firm grew, reporting took more time and became harder to trust.
LipwigMetrics gives that process a proper home.
One reporting system
Follow performance from its source to its result
LipwigMetrics connects the records that advisory firms already use to measure growth.
A marketing source creates a prospect. The prospect moves through appointments. Advisors record activity and outcomes. Production connects those outcomes to issued, pending, and potential business. Leadership reports read from the same underlying records.
Marketing source
See which campaigns, referrals, and other sources bring prospects into the firm.
Prospect
Track each prospect through discovery, scheduled meetings, milestone appointments, conversion, or loss.
Appointment
Record appointment types, outcomes, advisors, locations, processors, and related investment amounts.
Advisor
Compare activity, close ratios, production, and other agreed measures using consistent definitions.
Production
Track issued, pending, and potential production against firm goals.
Leadership reporting
Review firm performance without assembling a new management pack by hand.
Reporting areas
The numbers leadership needs, connected to the work behind them
Firm performance and goal progress
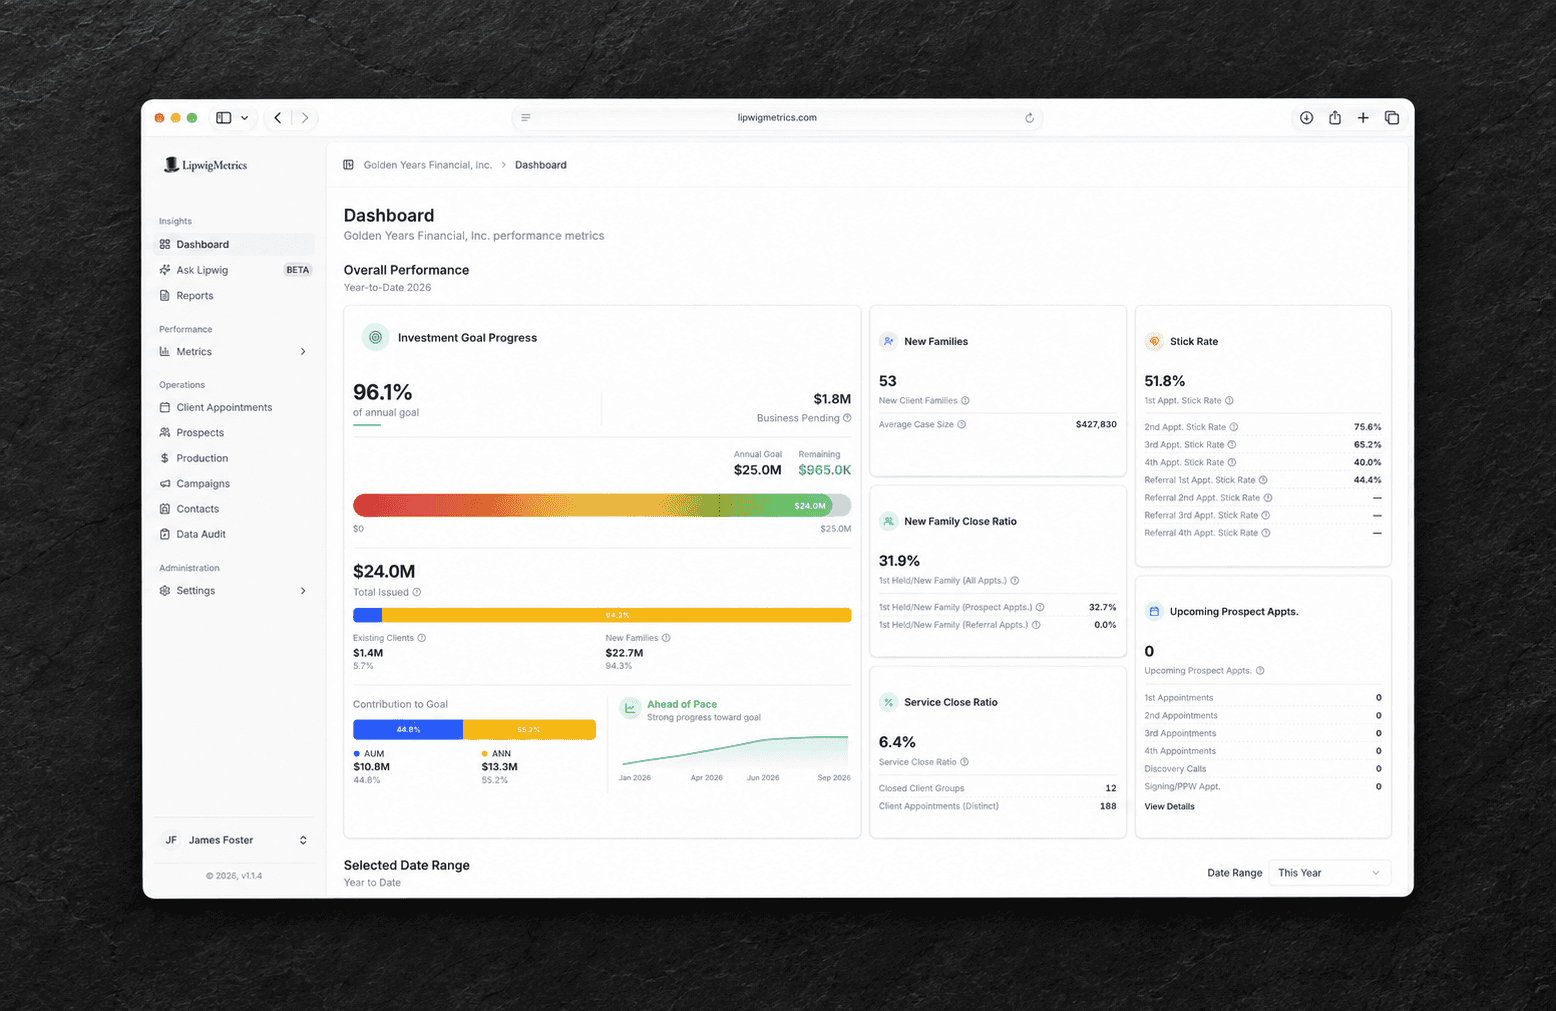
See issued production, investment goal progress, new families, close ratios, and other key measures for the calendar year or a selected reporting period.
Prospect and appointment conversion
Follow prospects through discovery calls and appointment milestones. Identify where prospects continue, convert, or leave the process.
Marketing campaign and source performance
Connect campaigns and sources to prospect activity, appointments, and production. Marketing reporting stays tied to business outcomes.
Advisor activity and outcomes
Review advisor activity, close ratios, pipeline, and production using the same definitions across the firm.
Production reporting
Track issued, pending, and potential production. Break results down by advisor, office, source, carrier, product, or reporting period.
Executive reporting
Give leadership a repeatable summary of firm performance, pipeline, marketing results, and progress against goals.
Data quality
Find missing fields, duplicate records, sequence problems, and inconsistent information before they affect a management report.
“LipwigMetrics gives me the data I need to understand our performance at a deeper level and make better-informed decisions. I can support those decisions with data and act with greater confidence, instead of relying on gut feel.”
Built for advisory teams
Give each team the view it needs
Firm leadership
Review performance against goals, monitor the prospect pipeline, compare advisor outcomes, and prepare for leadership meetings with current information.
Operations and administration
Manage prospects, appointments, production, contacts, households, users, permissions, and reporting data in one firm workspace.
Marketing teams
Measure campaign and source performance against prospect activity, appointment milestones, conversions, and production.
Advisors and office managers
Review advisor-level activity and outcomes without maintaining a separate scorecard for every person or office.
LipwigMetrics can support boutique advisory practices and larger wealth groups. Every subscription includes unlimited advisors, so advisor headcount does not determine the price.
Getting started
Keep the knowledge your firm has already built
Your current spreadsheets and reports contain years of decisions about what the firm measures and how leadership reviews performance. Moving to LipwigMetrics does not mean discarding that work.
The process begins with understanding it.
Show us how you report today
Walk us through the reports, scorecards, spreadsheets, CRM exports, and management packs your team currently uses.
Define the measures that matter
We identify the key performance indicators, reporting periods, data sources, and definitions that should carry into the new system.
Configure the firm workspace
We configure LipwigMetrics around the firm’s advisors, offices, goals, permissions, campaign structure, and reporting needs.
Import appropriate historical data
We review the available data and determine what can be imported, what needs preparation, and what should remain in its existing system.
Train the team
We help users understand their responsibilities and establish a repeatable reporting routine.
Firm-level control
Reporting depends on data people can trust
Each firm works in its own LipwigMetrics workspace. Users only see the advisors, prospects, appointments, production, and reports associated with their organization.
Firm administrators control user accounts and permissions. Access can be limited according to a person’s operational or reporting responsibilities.
Campaign costs and return data can be hidden from users who do not have permission to view them. The same access rules apply across dashboards, detailed reports, and leadership summaries.
The Data Audit workspace helps operations teams identify:
- Missing required information
- Possible duplicate appointments
- Prospect milestone sequence problems
- Inconsistent or older field values
- Records with missing contact links
Users can correct many flagged records within the audit process instead of maintaining a separate cleanup spreadsheet.
Currently in beta
BetaAsk questions of the data your firm already trusts
Ask Lipwig helps users explore firm metrics in plain language.
A leader might ask which advisors generated the most new business from marketing prospects during the year. A marketing user might ask which sources produced the most first appointments. An operations manager might ask where prospects are leaving the appointment process.
Ask Lipwig works with the structured information already inside the firm’s LipwigMetrics workspace. It respects firm access rules and does not replace professional judgment.
Users can also review previous conversations and export results for follow-up or documentation.
Strategy and engineering
A working example of software built around a real business process
Brehnor Communications partnered on the strategy and engineering behind LipwigMetrics, turning an established advisory-firm reporting process into a production-ready application.
The work required more than placing charts on top of a database. The product needed clear reporting definitions, connected operational records, controlled user access, firm-level data separation, reliable reports, and a structure that could continue to grow.
LipwigMetrics reflects the way Brehnor approaches production software. We begin with the business problem and the people who use the system. We then design and engineer the application around the work they need to perform.
Have a reporting process, internal tool, or prototype that needs to become production software?
Inside LipwigMetrics
See how daily records become management information
Firm dashboard
Review calendar-year performance, selected-period measures, investment goal progress, pipeline potential, close ratios, and upcoming appointments.
A firm-wide view of performance against goals.
Prospect pipeline
Follow active prospects through discovery, appointment milestones, conversion, or loss. Review potential investment amounts and upcoming activity.
See where prospects are progressing and where they stop.
Campaign and source reporting
Compare campaign costs and sources with prospect activity, appointment milestones, conversions, and production.
Connect marketing activity to measurable firm outcomes.
Advisor reporting
Compare advisor activity, close ratios, appointments, prospects, and production using shared definitions.
Review advisor performance without rebuilding individual scorecards.
Data Audit
Find incomplete or inconsistent records before they reach the management report.
Resolve reporting gaps within the same system that produces the report.
Frequently asked questions
Common questions about LipwigMetrics
See LipwigMetrics in action
Start with the reporting process you have today
Show us how your firm currently tracks advisor performance, prospects, appointments, marketing, and production.
We will help you assess how that process could work in LipwigMetrics and walk you through the parts of the platform that matter to your team.
Questions about the platform? Contact info@lipwigmetrics.com.